CU financial figures have award-winning showcase
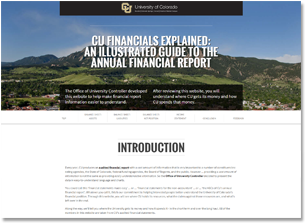
For those of us who don’t know our deferred outflows from our assets, the Office of University Controller developed a website that makes it easier to understand where the University of Colorado’s money comes from and how it is spent.
The site turns a copious amount of data from the university’s annual financial report into a carnival of colorful graphs and illustrations and explains number combinations that only an accountant could love. There are definitions for terms you don’t toss around every day such as “compensated absences,” and all of this is overlaid onto iconic university scenes.
Like a mini accounting lesson, “CU Financials Explained: An Illustrated Guide to the Annual Financial Report” explains various resources and expenses and how they come together to determine the health of the university.
CU might be one of the first higher education institutions to use HTML to explain where it stands financially. That pioneering approach has earned the university the 2014 Innovation Award from the National Association of College and University Business Officers, and some envious looks from other colleges.
Historically, the university had printed copies of its annual report for distribution and posted a PDF of the report online. Over the years, the costs of color printing had become prohibitive. The charge for 100 copies was about $5,000 -- quite a sum for an office with a total operating budget of $20,000, especially if you consider that such hefty reports usually receive a once-over by readers then are shelved or tossed.
Always wanting to save money, Robert Kuehler, assistant vice president/university controller, thought about passing the printing duties to the university’s auditors, but after some discussion, Kuehler and his staff decided to move in another direction.
Part of Travis Chillemi’s job as the strategic communication technology manager was to post the PDF of the annual report online every year.
“I’m a communicator, graphic designer and web designer in the controller’s office so I’m surrounded by finance people,” Chillemi said. “I would ask questions: Why do we put this online? How are people using it? The accountants knew the university was in good hands, but what about laypeople like me?”
He wanted to make the report more accessible to everyone who potentially would use it, from federal funding agencies to the Board of Regents to alumni.
“It was a nice online report, but unless you’re an accountant, it was like reading a foreign language,” Kuehler said.
In order for people to interact with the report, the format needed to be changed, said Chillemi. The PDF was tossed and an HTML version was put in its place. “It’s more approachable. You can click on things you have questions about and the answers show up,” he said. Now there’s no need to flip through 80-plus pages of text to find certain details.
And Kuehler developed plain language to walk the reader through the fundamentals of the report.
Text explains, for instance, why “unearned revenue” is a liability and why investment income “swings wildly from year to year.” As for compensated absences, the website says, “This amount primarily represents the $ value of paid time off earned but not yet used by CU employees.”
Even the university’s auditors from CliftonLarsonAllen gave the site a thumbs up. “They were cautious,” said Chillemi. But after seeing a mock-up “they were along for the ride.”
It took about five months of trial and error to build the HTML report and another two to three months to develop the guide. The report was posted late last year, and the guide followed this spring.
Kuehler and Chillemi have a few tweaks in mind for this year’s report, and at some point, Chillemi hopes to add a few more bells and whistles, including video.
Chillemi credits the support and entrepreneurial spirit at CU for the innovative approach to something as traditional as an annual report. “It will save us money and it’s sustainable. And for those who aren’t interested, we still post a very vanilla black and white report that just contains the numbers.”
Visit the site at http://www.cu.edu/controller/annualreport/illustratedguide/


